Market Outlook
January 03, 2018
Market Cues
Domestic Indices
Chg (%)
(Pts)
(Close)
Indian markets are likely to open positive tracking global indices and SGX Nifty.
BSE Sensex
(0.0)
(0)
33,812
US stocks have moved mostly higher on the first trading day of the New Year,
Nifty
0.1
7
10,442
adding to the strong gains posted in 2017. The major averages have all moved to
Mid Cap
(0.6)
(110)
17,725
the upside, with the tech-heavy Nasdaq showing a particularly strong upward move.
Small Cap
(0.6)
(122)
19,158
The Dow Jones is up 0.4% to close at 24,824and the Nasdaq Composite or 1.5%,
Bankex
(0.2)
(50)
28,589
to 7,007.
U.K. shares fell on profit despite positive manufacturing data from China and
Global Indices
Chg (%)
(Pts)
(Close)
ebbing tensions on the Korean Peninsula. The FTSE 100 is down by 0.5% to close at
Dow Jones
0.4
105
24,824
7,648.
Nasdaq
1.5
104
7,007
On domestic front, Indian shares may open slightly higher as the dollar remains in
FTSE
(0.5)
(40)
7,648
the doldrums. Positive global cues may also offer a helping hand while higher levels
Nikkei
(0.1)
(19)
22,765
may trigger some profit taking ahead of corporate results and amid soaring global
Hang Seng
0.5
144
30,659
crude prices. The Sensex ended on a flat note at 33,812.The Nifty ended at 10,442,
Shanghai Com
0.7
24
3,372
having a slightly upside of 0.1%.
News Analysis
Advances / Declines
BSE
NSE
Neelkamal Ltd. - Buy- CMP: 1880 TP: 2178 Upside : 16%
Advances
1,131
647
Declines
1,736
1,164
Detailed analysis on Pg2
Unchanged
108
44
Investor’s Ready Reckoner
Key Domestic & Global Indicators
Volumes (` Cr)
Stock Watch: Latest investment recommendations on 150+ stocks
BSE
5,009
Refer Pg5 onwards
NSE
31,951
Top Picks
CMP
Target
Upside
Net Inflows (` Cr)
Net
Mtd
Ytd
Company
Sector
Rating
(`)
(`)
(%)
FII
(11)
(11)
-11
Blue Star
Capital Goods Accumulate
818
867
6.0
Dewan Housing Finance
Financials
Buy
583
712
22.0
*MFs
1,012
6,114 1,16,352
Asian Granito
Other
Accumulate
569
639
12.4
Navkar Corporation
Other
Buy
189
265
40.1
Top Gainers
Price (`)
Chg (%)
KEI Industries
Capital Goods
Buy
373
436
16.9
Advenzymes
311
11.5
More Top Picks on Pg4
Nmdc
149
5.6
Key Upcoming Events
Videoind
22
4.9
Previous
Consensus
Date
Region
Event Description
Redington
185
4.4
Reading
Expectations
Jan03
US
Initial Jobless claims
245.00
247.50
Dishtv
85
4.3
Jan04
Germany Unemployment change (000's)
(18.00)
(13.00)
Jan04
Germany PMI Services
55.80
55.80
Top Losers
Price (`)
Chg (%)
Jan05
Euro Zone Euro-Zone Consumer Confidence
0.50
Rcom
32
(8.6)
Jan05
US
Change in Nonfarm payrolls
228.00
188.00
More Events on Pg7
Rnaval
60
(8.4)
Rpower
57
(6.0)
Unitech
11
(5.3)
Ifci
29
(5.1)
As on January 02 2018
Market Outlook
January 03, 2018
News Analysis
Neelkamal Ltd. - Buy- CMP: 1880 TP: 2178 Upside: 16%
About Company: Nilkamal Ltd is engaged in the manufacturing of plastic products
and retail sales. The company has three divisions, viz plastics, lifestyle furniture,
and furnishings & accessories.Nilkamal’s manufacturing plants are located at
Barjora in West Bengal, Hosur in Tamil Nadu, Jammu, Kharadapada and Vasona
in Dadra & Nagar Haveli, Noida in UP, Sinnor and Nashik in Maharashtra and in
Pudducherry.
Outlook and Valuation: We forecast Nilkamal to report healthy top-line CAGR of
~9% to `2,635cr over FY17-20E on the back of healthy demand growth in plastic
division. On the bottom-line front (reported PAT), we estimate ~10% CAGR to
`162cr owing to healthy improvement in volume. Further, healthy margin and
lower interest cost to aid the profitabitly. We initiate coverage on Nilkamal with a
Buy recommendation and target price of `2,178 (20x FY2020E EPS), indicating an
upside of ~16% from the current levels.
Y/E March (` cr)
FY2016
FY2017
FY2018E
FY2019E FY2020E
Net Sales
1,926
2,024
2,097
2,333
2,635
% chg
1.7
5.1
3.6
11.3
12.9
Net Profit
114
123
123
141
162
% chg
126.0
7.4
0.7
14.6
15.0
OPM (%)
11.9
11.4
11.3
11.3
11.2
EPS (Rs)
76.4
82.1
82.7
94.7
108.9
P/E (x)
24.6
22.9
22.7
19.8
17.3
P/BV (x)
4.5
3.8
3.3
2.8
2.4
RoE (%)
18.2
16.5
14.4
14.2
14.1
RoCE (%)
23.9
22.0
19.2
19.6
19.7
EV/Sales (x)
1.5
1.4
1.3
1.2
1.0
EV/EBITDA (x)
12.4
12.2
11.9
10.6
9.3
Economic and Political News
Finance Ministry to relaunch GoI bonds with 7.75% rate
Budget 2018: Education sector to get a boost by up to 14%
India's GDP growth at 6.5% in FY18, will accelerate to 7.6% in FY20
Corporate News
Mahindra tractor sales up 30% in December at 18,288 units
Airtel counters Jio with updated Rs 799 pack offering 3.5 GB data per day
Tata Motors total sales jump 52% to 54,627 units in December
Market Outlook
January 03, 2018
Top Picks HHHHH
Market Cap
CMP
Target
Upside
Company
Rationale
(` Cr)
(`)
(`)
(%)
Strong growth in domestic business due to its leade`hip
in acute therapeutic segment. Alkem expects to launch
Alkem Laboratories
26,305
2,200
2,341
6.4
more products in USA, which bodes for its international
business.
We expect the company would report strong profitability
Asian Granito
1,710
569
639
12.4
owing to better product mix, higher B2C sales and
amalgamation synergy.
Favorable outlook for the AC industry to augur well for
Cooling products business which is out pacing the
Blue Star
7,844
818
867
6.0
market growth. EMPPAC division's profitability to
improve once operating environment turns around.
With a focus on the low and medium income (LMI)
consumer segment, the company has increased its
Dewan Housing Finance
18,296
583
712
22.0
presence in tier-II & III cities where the growth
opportunity is immense.
Loan growth is likely to pick up after a sluggish FY17.
Lower credit cost will help in strong bottom-line growth.
Karur Vysya Bank
8,775
122
180
48.0
Increasing share of CASA will help in NIM
improvement.
High order book execution in EPC segment, rising B2C
KEI Industries
2,922
373
436
16.9
sales and higher exports to boost the revenues and
profitability
Expected to benefit from the lower capex requirement
Music Broadcast
2,178
382
434
13.7
and 15 year long radio broadcast licensing.
Massive capacity expansion along with rail advantage
Navkar Corporation
2,846
189
265
40.1
at ICD as well CFS augur well for the company
Strong brands and distribution network would boost
Siyaram Silk Mills
3,373
720
813
13.0
growth going ahead. Stock currently trades at an
inexpensive valuation.
Market leadership in Hindi news genre and no.
2
viewership ranking in English news genre, exit from the
TV Today Network
2,556
429
500
16.7
radio business, and anticipated growth in ad spends by
corporate to benefit the stock.
After GST, the company is expected to see higher
volumes along with improving product mix. The Gujarat
Maruti Suzuki
2,88,340
9,545
10,619
11.3
plant will also enable higher operating leverage which
will be margin accretive.
We expect loan book to grow at 24.3% over next two
GIC Housing
2,456
456
655
43.6
year; change in borrowing mix will help in NIM
improvement
We expect CPIL to report net Revenue/PAT CAGR of
~17%/16% over FY2017-20E mainly due to healthy
7,528
339
400
18.0
growth in plywood & lamination business, forayed into
Century Plyboards India
MDF & Particle boards on back of strong brand &
distribution network.
We expect sales/PAT to grow at 13.5%/20% over next
LT Foods
2,899
91
102
12.5
two years on the back of strong distribution network &
addition of new products in portfolio.
We expect sales/PAT to grow at 13%/16% over next two
years on the back of strong healthy demand in writing
Ruchira Papers
449
200
244
22.0
& printing paper and Kraft paper. Further, China had
banned making paper from waste pulp which would
benefit Indian paper companies.
Source: Company, Angel Research
Market Outlook
January 03, 2018
Key Upcoming Events
Global economic events release calendar
Bloomberg Data
Date
Time Country
Event Description
Unit
Period
Last Reported
Estimated
Jan 03, 2018
7:00 PMUS
Initial Jobless claims
Thousands
Dec 30
245.00
247.50
Jan 04, 2018
2:25 PMGermany
Unemployment change (000's)
Thousands
Dec
(18.00)
(13.00)
2:25 PMGermany
PMI Services
Value
Dec F
55.80
55.80
Jan 05, 2018
3:30 PMEuro Zone
Euro-Zone Consumer Confidence
Value
Dec F
0.50
7:00 PMUS
Change in Nonfarm payrolls
Thousands
Dec
228.00
188.00
Jan 08, 2018
7:00 PMUS
Unnemployment rate
%
Dec
4.10
4.10
Jan 10, 2018
3:00 PMUK
Industrial Production (YoY)
% Change
Nov
3.60
India
Imports YoY%
% Change
Dec
19.60
India
Exports YoY%
% Change
Dec
30.60
7:00 AMChina
Consumer Price Index (YoY)
% Change
Dec
1.70
1.90
Jan 11, 2018
US
Producer Price Index (mom)
% Change
Dec
1.40
Jan 12, 2018
China
Exports YoY%
% Change
Dec
12.30
10.00
7:00 PMUS
Consumer price index (mom)
% Change
Dec
0.40
0.20
Jan 15, 2018
12:00 PMIndia
Monthly Wholesale Prices YoY%
% Change
Dec
3.93
Jan 16, 2018
3:00 PMUK
CPI (YoY)
% Change
Dec
3.10
Jan 17, 2018
7:45 PMUS
Industrial Production
%
Dec
0.20
3:30 PMEuro Zone
Euro-Zone CPI (YoY)
%
Dec F
1.50
Jan 18, 2018
7:00 PMUS
Housing Starts
Thousands
Dec
1,297.00
7:00 PMUS
Building permits
Thousands
Dec
1,303.00
7:30 AMChina
Industrial Production (YoY)
% Change
Dec
6.10
7:30 AMChina
Real GDP (YoY)
% Change
4Q
6.80
Jan 24, 2018
8:30 PMUS
Existing home sales
Million
Dec
5.81
3:00 PMUK
Jobless claims change
% Change
Dec
5.90
Jan 25, 2018
8:30 PMUS
New home sales
Thousands
Dec
733.00
Source: Bloomberg, Angel Research
Market Outlook
January 03, 2018
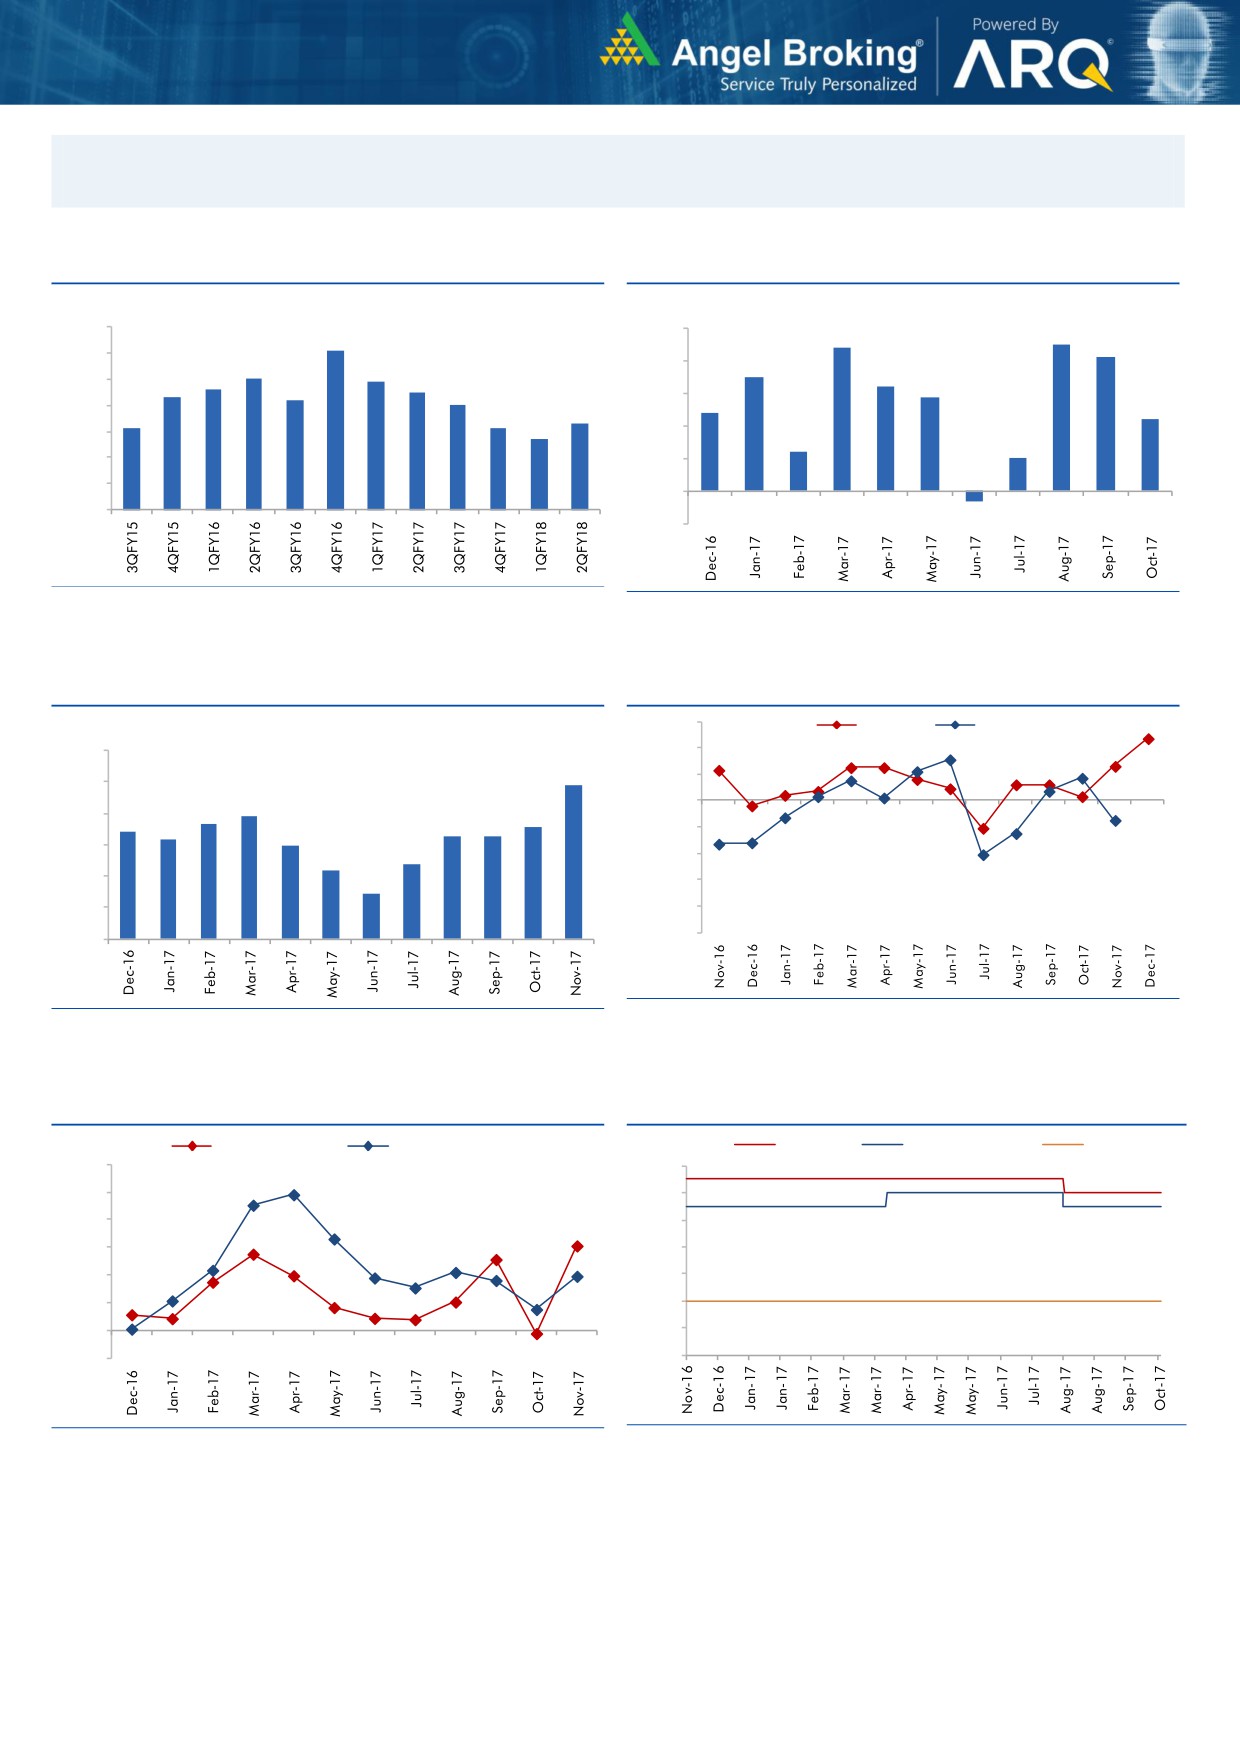
Macro watch
Exhibit 1: Quarterly GDP trends
Exhibit 2: IIP trends
(%)
(%)
10.0
5.0
4.5
9.1
4.4
4.1
9.0
8.0
7.9
4.0
3.5
7.6
7.5
3.2
8.0
7.3
7.2
2.9
7.0
3.0
2.4
7.0
6.3
2.2
6.1
6.1
5.7
2.0
6.0
1.2
1.0
5.0
1.0
4.0
-
3.0
(1.0)
(0.3)
Source: CSO, Angel Research
Source: MOSPI, Angel Research
Exhibit 3: Monthly CPI inflation trends
Exhibit 4: Manufacturing and services PMI
56.0
Mfg. PMI
Services PMI
(%)
6.0
54.0
4.9
52.0
5.0
3.9
50.0
4.0
3.7
3.6
3.4
3.3
3.3
3.2
3.0
48.0
3.0
2.4
2.2
46.0
2.0
1.5
44.0
1.0
42.0
40.0
-
Source: Market, Angel Research; Note: Level above 50 indicates expansion
Source: MOSPI, Angel Research
Exhibit 5: Exports and imports growth trends
Exhibit 6: Key policy rates
(%)
Exports yoy growth
Imports yoy growth
(%)
Repo rate
Reverse Repo rate
CRR
60.0
6.50
50.0
6.00
40.0
5.50
30.0
5.00
20.0
4.50
10.0
4.00
0.0
3.50
(10.0)
3.00
Source: Bloomberg, Angel Research
Source: RBI, Angel Research
Market Outlook
January 03, 2018
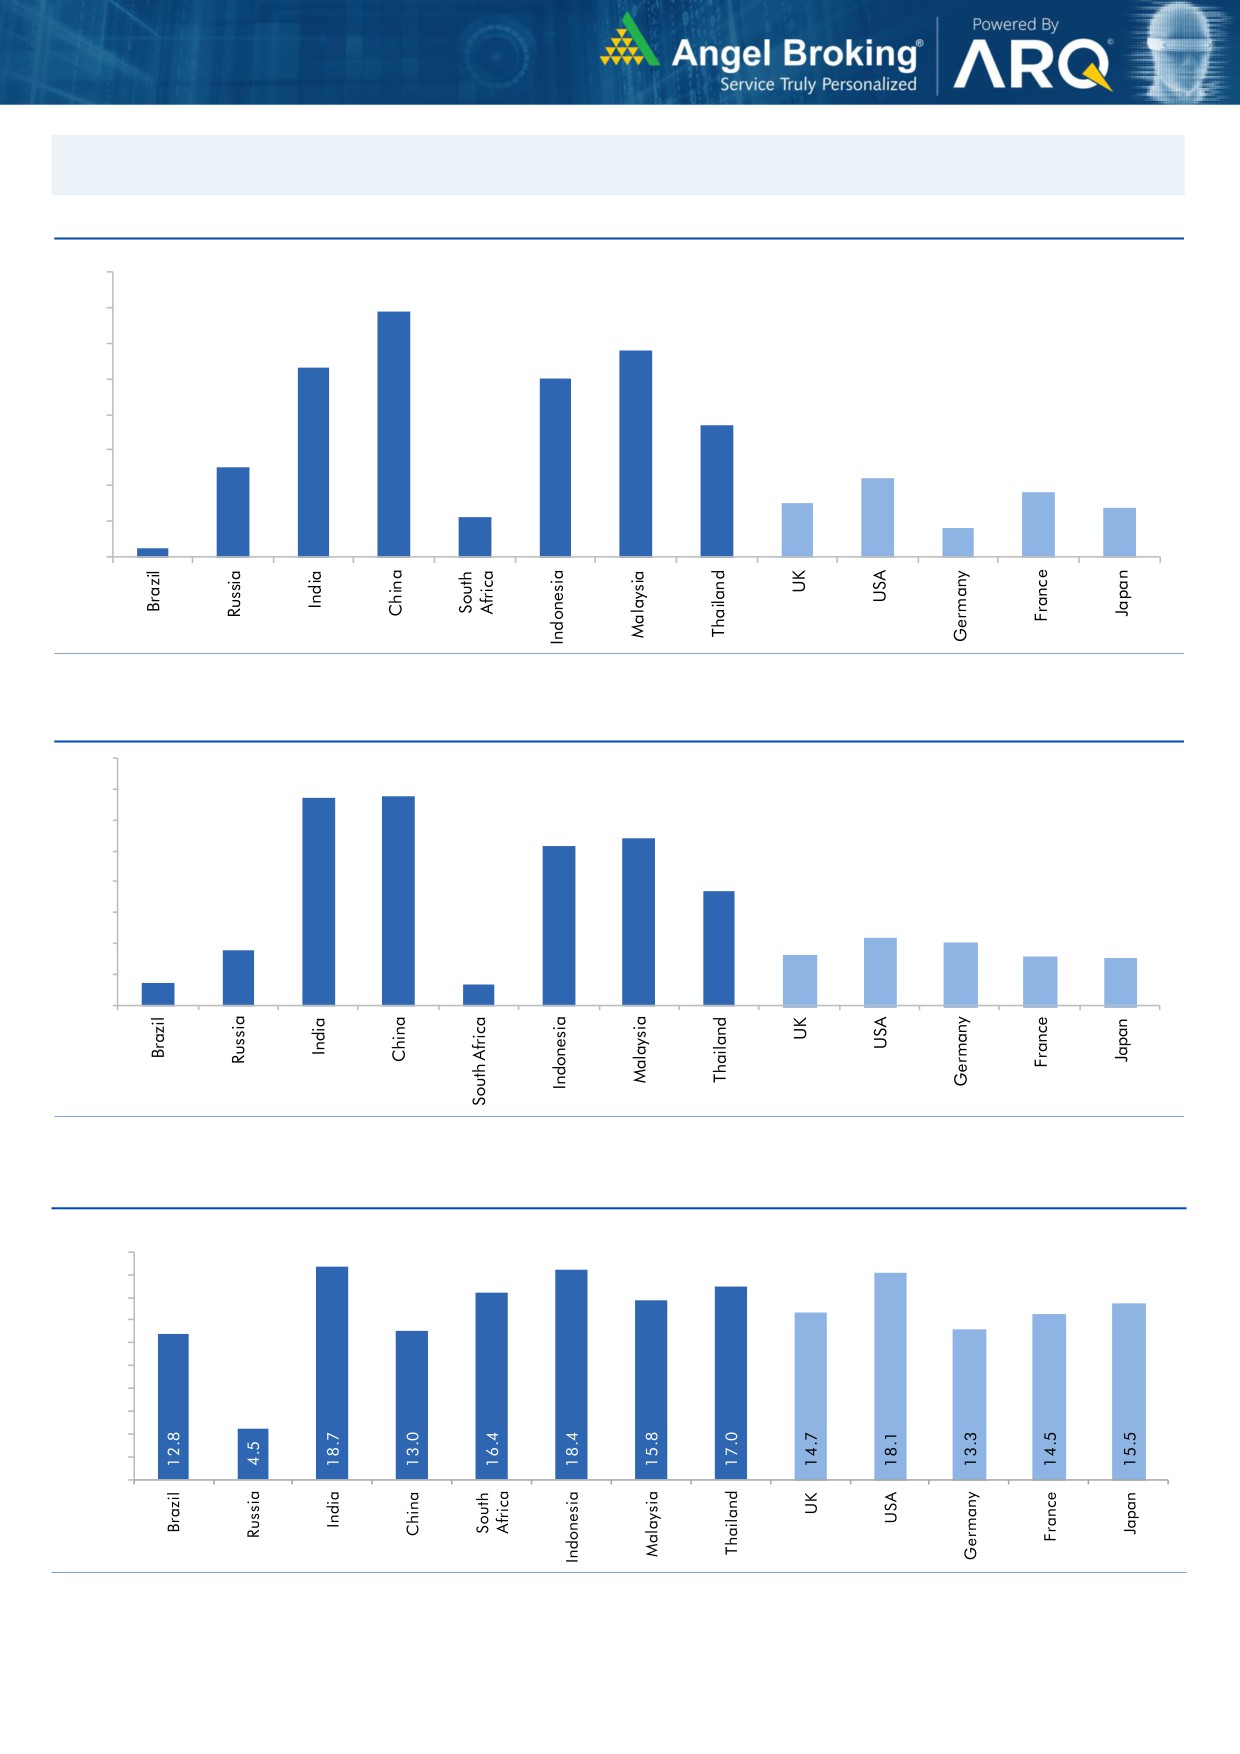
Global watch
Exhibit 1: Latest quarterly GDP Growth (%, yoy) across select developing and developed countries
(%)
8.0
6.9
7.0
5.8
6.0
5.3
5.0
5.0
1.1
3.7
4.0
2.5
3.0
2.2
1.8
2.0
1.5
1.4
0.8
1.0
0.3
-
Source: Bloomberg, Angel Research
Exhibit 2: 2017 GDP Growth projection by IMF (%, yoy) across select developing and developed countries
(%)
6.7
6.8
7.0
6.0
5.4
5.2
5.0
3.7
4.0
3.0
1.8
2.2
2.0
1.7
1.6
2.0
0.7
1.5
0.7
1.0
-
Source: IMF, Angel Research
Exhibit 3: One year forward P-E ratio across select developing and developed countries
(x)
20.0
18.0
16.0
14.0
12.0
10.0
8.0
6.0
4.0
2.0
-
Source: IMF, Angel Research
Market Outlook
January 03, 2018
Exhibit 4: Relative performance of indices across globe
Returns (%)
Country
Name of index
Closing price
1M
3M
1YR
Brazil
Bovespa
77,891
5.1
4.6
34.4
Russia
Micex
2,110
(0.7)
1.6
(7.7)
India
Nifty
10,442
2.1
6.7
28.9
China
Shanghai Composite
3,348
1.6
0.8
8.4
South Africa
Top 40
52,824
(1.5)
7.0
20.1
Mexico
Mexbol
50,034
5.9
(0.3)
9.5
Indonesia
LQ45
1,076
4.4
9.2
21.1
Malaysia
KLCI
1,783
4.0
1.4
9.4
Thailand
SET 50
1,135
4.7
6.3
20.7
USA
Dow Jones
24,824
3.7
10.8
24.9
UK
FTSE
7,648
2.5
3.7
6.4
Japan
Nikkei
22,765
0.7
12.3
17.4
Germany
DAX
12,871
(1.4)
1.7
11.1
France
CAC
5,289
(1.9)
(0.8)
7.7
Source: Bloomberg, Angel Research p68in4
Stock Watch
January 03, 2018
Company Name
Reco
CMP
Target
Mkt Cap
Sales ( Čcr )
OPM(%)
EPS (Č)
PER(x)
P/BV(x)
RoE(%)
EV/Sales(x)
(Č)
Price ( Č)
( Č cr )
FY18E FY19E
FY18E
FY19E
FY18E
FY19E
FY18E
FY19E
FY18E
FY19E
FY18E
FY19E
FY18E
FY19E
Agri / Agri Chemical
Rallis
Sell
266
209
5,166
1,873
2,099
15.0
15.0
9.5
10.5
28.0
25.3
4.2
3.8
15.8
16.0
2.7
2.4
United Phosphorus
Accumulate
772
820
39,253
18,922
21,949
18.0
18.5
36.2
45.6
21.3
16.9
4.5
3.7
22.7
23.8
2.2
1.9
Auto & Auto Ancillary
Ashok Leyland
Neutral
123
-
36,091
23,339
27,240
10.1
10.8
4.7
6.2
26.5
19.8
5.3
4.7
20.0
23.6
1.5
1.3
Bajaj Auto
Neutral
3,294
-
95,322
23,936
27,955
19.5
20.1
142.7
167.3
23.1
19.7
5.0
4.5
21.8
22.8
3.6
3.0
Bharat Forge
Buy
727
875
33,832
7,637
8,755
21.7
23.2
36.1
47.3
20.1
15.4
3.6
3.1
18.5
20.8
4.3
3.7
Eicher Motors
Neutral
28,697
-
78,162
19,043
22,837
19.5
19.9
835.4
1,019.0
34.4
28.2
12.8
9.9
40.9
37.8
4.0
3.3
Gabriel India
Neutral
200
-
2,866
1,782
2,033
9.7
10.2
7.1
8.9
28.1
22.5
5.7
4.8
21.0
22.2
1.6
1.3
Hero Motocorp
Accumulate
3,747
4,129
74,839
32,239
36,878
16.0
15.6
184.4
206.5
20.3
18.2
6.4
5.6
31.3
30.7
2.1
1.8
Jamna Auto Industries Neutral
82
-
3,251
1,441
1,662
14.4
14.8
13.9
17.6
5.9
4.6
1.6
1.3
30.0
31.0
2.3
1.9
Mahindra and Mahindra Neutral
753
-
93,550
46,971
53,816
13.6
14.0
67.7
79.8
11.1
9.4
1.6
1.4
15.0
15.9
1.9
1.6
Maruti
Accumulate
9,545
10,619
288,340
79,470
95,208
15.9
17.2
281.7
363.8
33.9
26.2
7.4
6.0
21.7
22.8
3.3
2.7
Minda Industries
Neutral
1,276
-
11,029
4,328
5,084
11.0
11.9
27.3
36.4
46.8
35.1
9.9
7.8
23.1
25.6
2.6
2.2
Motherson Sumi
Neutral
379
-
79,712
55,937
64,445
10.8
11.4
16.9
21.1
22.4
18.0
5.0
5.1
25.2
25.4
1.5
1.2
Tata Motors
Neutral
439
-
126,711
303,167
343,649
11.8
13.8
33.1
54.7
13.3
8.0
2.2
1.7
16.9
23.0
0.5
0.4
TVS Motor
Neutral
776
-
36,848
13,992
16,216
9.0
9.4
17.1
20.3
45.5
38.2
12.1
9.3
29.7
27.7
2.6
2.2
Amara Raja Batteries
Neutral
830
-
14,169
6,140
7,122
14.3
15.6
29.3
39.0
28.3
21.3
4.8
4.1
17.1
19.0
2.3
2.0
Exide Industries
Neutral
221
-
18,781
8,689
9,854
15.1
15.2
9.7
11.0
22.9
20.1
4.1
3.6
15.7
16.1
1.9
1.7
Apollo Tyres
Neutral
268
-
15,302
15,739
17,326
13.3
14.6
20.4
26.7
13.1
10.0
1.6
1.4
20.4
26.7
1.2
1.1
Ceat
Neutral
1,919
-
7,763
6,661
7,717
11.1
14.2
116.2
178.2
16.5
10.8
2.9
2.4
15.2
21.3
1.3
1.1
JK Tyres
Neutral
145
-
3,291
8,318
9,239
16.2
16.4
21.0
27.5
6.9
5.3
1.3
1.1
19.1
20.4
0.8
0.7
Swaraj Engines
Neutral
2,092
-
2,598
788
889
16.4
16.5
71.6
81.0
29.2
25.8
8.4
7.8
29.6
31.0
3.0
2.6
Subros
Neutral
303
-
1,820
1,855
2,135
11.6
11.8
10.3
14.7
29.6
20.7
4.5
3.9
15.8
19.1
1.2
1.0
Capital Goods
BEML
Neutral
1,577
-
6,565
4,286
5,194
7.1
8.2
42.9
58.1
36.8
27.1
3.0
2.7
7.6
8.7
1.6
1.3
Bharat Electronics
Neutral
182
-
44,631
10,258
12,470
19.6
19.5
7.3
8.6
24.9
21.1
0.5
0.4
20.4
21.9
3.8
3.1
Voltas
Neutral
647
-
21,420
6,778
8,004
9.6
11.0
17.1
22.4
37.9
28.9
9.0
7.9
17.7
19.8
2.9
2.4
BHEL
Neutral
98
-
35,980
33,200
39,167
6.8
9.5
6.2
11.2
15.8
8.8
0.7
0.7
4.6
8.0
0.7
0.5
Blue Star
Accumulate
818
867
7,844
5,220
6,207
6.3
6.6
16.8
22.3
48.7
36.7
9.7
8.5
19.9
23.3
1.5
1.2
CG Power and Industrial
Neutral
91
-
5,675
6,555
7,292
7.5
7.5
-
0.8
9,055.0
113.2
1.4
1.4
0.1
1.2
1.0
0.9
Solutions
Greaves Cotton
Neutral
139
-
3,405
1,778
1,993
14.7
15.1
8.1
9.1
17.2
15.3
3.9
3.6
21.8
23.6
1.7
1.5
Stock Watch
January 03, 2018
Company Name
Reco
CMP
Target
Mkt Cap
Sales ( Čcr )
OPM(%)
EPS (Č)
PER(x)
P/BV(x)
RoE(%)
EV/Sales(x)
(Č)
Price ( Č)
( Č cr )
FY18E FY19E
FY18E
FY19E
FY18E
FY19E
FY18E
FY19E
FY18E
FY19E
FY18E
FY19E
FY18E
FY19E
Capital Goods
KEC International
Neutral
381
-
9,802
9,779
11,113
9.4
9.8
14.2
18.2
26.9
21.0
5.1
4.2
21.1
22.1
1.3
1.1
KEI Industries
Buy
374
436
2,928
3,001
3,391
10.0
10.0
13.0
16.1
28.7
23.2
5.2
4.3
18.2
18.7
1.2
1.0
Thermax
Neutral
1,217
-
14,501
4,125
4,747
10.3
10.8
26.7
31.5
45.6
38.6
5.1
4.7
11.2
12.0
3.2
2.8
VATech Wabag
Accumulate
623
681
3,405
3,867
4,126
9.6
10.0
34.9
39.8
17.9
15.7
3.0
2.5
17.7
17.5
0.9
0.8
Cement
ACC
Neutral
1,737
-
32,611
12,255
13,350
13.5
14.3
58.0
66.2
29.9
26.2
3.5
3.3
11.5
12.2
2.6
2.4
Ambuja Cements
Neutral
268
-
53,146
10,250
11,450
17.5
19.0
7.2
8.3
37.2
32.3
2.7
2.5
7.0
7.8
5.0
4.4
India Cements
Neutral
180
-
5,561
6,135
6,750
14.8
15.2
8.5
11.5
21.2
15.7
1.1
1.0
4.8
6.2
1.3
1.1
JK Cement
Neutral
1,117
-
7,807
4,150
4,775
19.2
20.0
49.0
63.5
22.8
17.6
3.6
3.1
17.0
18.5
2.3
2.0
J K Lakshmi Cement
Neutral
442
-
5,200
3,422
3,757
15.5
17.0
13.5
23.2
32.7
19.1
3.4
2.9
10.8
15.5
1.9
1.7
Orient Cement
Neutral
167
-
3,421
2,215
3,233
16.8
17.0
5.9
6.9
28.3
24.2
2.2
2.0
10.8
10.1
2.5
1.7
Prism Cement
Accumulate
115
131
5,806
5,155
5,616
7.0
7.0
2.0
3.0
57.7
38.5
5.3
4.6
10.0
13.8
1.4
1.3
UltraTech Cement
Neutral
4,255
-
116,823
28,250
35,150
20.2
23.5
77.5
122.2
54.9
34.8
4.6
4.2
9.6
14.8
4.6
3.7
Construction
KNR Constructions
Neutral
309
-
4,343
1,846
2,203
14.5
14.5
12.1
13.7
25.5
22.6
1.4
1.2
17.5
16.7
2.4
2.0
Larsen & Toubro
Neutral
1,249
-
175,003
95,787
109,476
10.2
11.6
44.5
50.8
28.1
24.6
3.5
3.2
12.9
13.1
2.4
2.1
Gujarat Pipavav Port
Neutral
138
-
6,693
739
842
61.6
62.7
5.1
6.2
27.2
22.5
3.4
3.3
12.7
14.9
8.5
7.4
PNC Infratech
Neutral
209
-
5,371
2,040
2,935
13.0
13.0
6.4
9.0
32.7
23.3
0.9
0.8
9.7
12.2
2.6
1.9
Simplex Infra
Neutral
579
-
2,863
6,012
6,619
11.6
11.7
21.1
31.0
27.5
18.7
1.9
1.8
6.5
8.6
1.0
0.9
Sadbhav Engineering
Neutral
426
-
7,311
3,823
4,426
10.7
10.8
10.3
11.8
41.4
36.1
5.0
4.4
10.1
10.5
2.2
1.9
NBCC
Neutral
244
-
21,920
9,099
12,706
6.4
6.4
7.3
9.6
33.5
25.5
1.5
1.2
27.5
30.5
2.3
1.6
MEP Infra
Neutral
93
-
1,505
2,403
2,910
18.3
16.8
2.4
6.1
39.4
15.2
14.9
10.1
35.2
55.8
1.8
1.5
SIPL
Neutral
143
-
5,046
2,060
2,390
46.8
47.7
(5.8)
(3.1)
5.4
6.1
(14.2)
(2.3)
7.2
6.7
Engineers India
Neutral
194
-
13,090
1,795
2,611
21.1
22.4
5.9
8.1
32.9
24.0
2.4
2.3
12.9
16.1
5.7
3.7
Financials
Axis Bank
Neutral
560
-
143,500
32,558
35,843
3.5
3.2
27.8
41.0
20.1
13.6
2.2
1.9
11.4
14.9
-
-
Bank of Baroda
Neutral
158
-
36,383
22,533
26,079
2.4
2.4
12.0
20.9
13.1
7.6
0.9
0.8
6.6
11.0
-
-
Canara Bank
Neutral
352
-
21,034
17,925
20,235
2.0
2.1
18.5
36.5
19.0
9.7
0.7
0.7
3.4
6.2
-
-
Can Fin Homes
Neutral
474
-
6,304
586
741
3.5
3.5
107.8
141.0
4.4
3.4
1.0
0.8
24.1
25.6
-
-
Cholamandalam Inv. &
Neutral
1,293
-
20,212
2,826
3,307
6.3
6.3
53.7
64.6
24.1
20.0
4.1
3.5
18.3
18.9
-
-
Fin. Co.
Dewan Housing Finance Buy
583
712
18,296
2,676
3,383
2.4
2.7
37.4
49.7
15.6
11.7
2.0
1.8
13.8
16.2
-
-
Equitas Holdings
Buy
146
235
4,969
1,125
1,380
9.6
9.8
1.5
6.0
97.5
24.4
2.2
2.1
2.4
8.2
-
-
Stock Watch
January 03, 2018
Company Name
Reco
CMP
Target
Mkt Cap
Sales ( Čcr )
OPM(%)
EPS (Č)
PER(x)
P/BV(x)
RoE(%)
EV/Sales(x)
(Č)
Price ( Č)
( Č cr )
FY18E FY19E
FY18E
FY19E
FY18E
FY19E
FY18E
FY19E
FY18E
FY19E
FY18E
FY19E
FY18E
FY19E
Financials
Federal Bank
Buy
108
125
21,167
4,896
5,930
2.8
3.1
5.4
7.6
20.1
14.2
1.7
1.6
8.5
11.0
-
-
GIC Housing
Buy
456
655
2,456
376
477
3.6
3.7
33.0
40.0
13.8
11.4
2.5
2.1
20.0
23.0
-
-
HDFC Bank
Neutral
1,873
-
485,053
55,236
63,253
4.5
4.4
68.9
82.4
27.2
22.7
4.7
3.9
18.7
18.5
-
-
ICICI Bank
Neutral
309
-
198,602
42,361
51,378
3.6
3.9
18.4
25.7
16.8
12.0
1.8
1.8
11.3
15.0
-
-
Karur Vysya Bank
Buy
122
180
8,775
3,289
3,630
3.7
3.9
10.8
14.1
11.2
8.6
1.3
1.2
12.5
14.7
-
-
LIC Housing Finance
Accumulate
563
630
28,395
4,895
6,332
3.4
3.7
50.7
66.8
11.1
8.4
2.2
1.8
21.7
23.8
-
-
Punjab Natl.Bank
Neutral
166
-
40,374
23,708
25,758
2.1
2.1
5.9
16.4
28.3
10.1
0.8
0.8
3.0
8.3
-
-
RBL Bank
Neutral
512
-
21,347
2,309
2,888
2.6
2.5
16.4
19.1
31.3
26.8
3.9
3.5
13.3
13.8
-
-
Repco Home Finance
Buy
687
825
4,300
496
597
4.4
4.2
38.5
48.7
17.9
14.1
3.2
2.7
19.6
20.6
-
-
South Ind.Bank
Neutral
31
-
5,598
3,195
3,567
3.0
3.1
3.0
3.8
10.3
8.1
1.0
0.9
10.5
11.9
-
-
St Bk of India
Neutral
303
-
261,465
105,827
121,056
2.4
2.5
16.1
25.6
18.8
11.8
1.5
1.3
6.6
9.9
-
-
Union Bank
Neutral
142
-
12,143
14,650
16,225
2.3
2.3
23.1
32.5
6.1
4.4
0.5
0.4
7.1
9.2
-
-
Yes Bank
Neutral
312
-
71,640
11,088
13,138
3.0
2.9
84.0
99.3
3.7
3.1
0.6
0.5
16.3
16.8
-
-
FMCG
Akzo Nobel India
Neutral
1,853
-
8,886
3,164
3,607
13.8
13.7
58.6
67.9
31.6
27.3
7.8
6.8
24.5
25.1
2.7
2.3
Asian Paints
Neutral
1,143
-
109,622
17,603
20,615
18.6
18.6
2,128.9
2,543.3
0.5
0.5
11.3
9.5
28.0
28.9
6.0
5.1
Britannia
Neutral
4,666
-
56,023
9,690
11,278
14.8
15.4
84.0
101.0
55.6
46.2
20.2
16.1
40.6
39.0
5.7
4.9
Colgate
Neutral
1,097
-
29,849
4,420
5,074
24.9
25.3
28.6
32.8
38.4
33.5
15.1
12.2
43.8
40.5
6.5
5.6
Dabur India
Neutral
350
-
61,565
8,346
9,344
19.6
19.9
7.8
9.0
44.8
38.8
9.0
8.2
25.2
24.8
7.0
6.1
GlaxoSmith Con*
Neutral
6,477
-
27,239
5,072
5,760
18.2
18.4
176.3
199.2
36.7
32.5
7.8
7.1
21.2
21.7
4.7
4.1
Godrej Consumer
Neutral
980
-
66,781
10,171
11,682
20.8
21.5
21.7
27.1
45.2
36.2
10.2
8.7
22.3
23.4
6.7
5.8
HUL
Neutral
1,339
-
289,921
37,077
41,508
20.3
21.8
5,189.9
6,318.5
0.3
0.2
40.8
34.9
74.8
82.0
7.7
6.9
ITC
Neutral
261
-
318,110
44,588
49,853
37.0
37.3
9.6
11.0
27.2
23.7
6.7
6.4
25.1
27.3
6.6
5.9
Marico
Neutral
325
-
41,892
6,788
7,766
18.5
19.2
7.1
8.5
45.7
38.2
16.0
13.7
36.9
38.0
6.0
5.2
Nestle*
Neutral
7,860
-
75,778
10,083
11,182
20.0
20.9
119.7
141.3
65.7
55.6
231.4
211.5
36.7
39.8
7.2
6.4
Tata Global
Neutral
311
-
19,638
7,121
7,641
11.9
12.3
6.9
8.0
45.1
38.9
3.0
2.9
6.8
7.2
2.6
2.4
Procter & Gamble
Neutral
9,389
-
30,477
3,034
3,579
27.1
27.7
167.7
198.8
56.0
47.2
15.0
12.9
28.8
29.5
9.5
7.9
Hygiene
IT
HCL Tech^
Accumulate
892
1,014
127,245
50,009
54,608
22.1
22.1
62.8
67.6
14.2
13.2
3.2
2.7
22.4
20.6
2.2
1.9
Infosys
Accumulate
1,030
1,120
236,475
70,333
75,960
26.0
26.0
61.7
65.9
16.7
15.6
3.2
2.9
18.9
18.7
2.8
2.5
TCS
Reduce
2,634
2,442
504,176
123,384
134,488
26.1
26.1
133.2
143.7
19.8
18.3
5.5
5.1
27.6
27.8
3.7
3.4
Stock Watch
January 03, 2018
Company Name
Reco
CMP
Target
Mkt Cap
Sales ( Čcr )
OPM(%)
EPS (Č)
PER(x)
P/BV(x)
RoE(%)
EV/Sales(x)
(Č)
Price ( Č)
( Č cr )
FY18E FY19E
FY18E
FY19E
FY18E
FY19E
FY18E
FY19E
FY18E
FY19E
FY18E
FY19E
FY18E
FY19E
IT
Tech Mahindra
Neutral
512
-
50,061
30,545
32,988
15.0
15.0
35.2
37.6
14.6
13.6
2.4
2.3
16.8
16.2
1.4
1.2
Wipro
Neutral
319
-
155,199
54,164
56,544
22.3
22.3
18.8
19.5
17.0
16.4
2.7
2.3
15.0
13.6
2.1
1.9
Media
D B Corp
Neutral
357
-
6,575
2,404
2,625
30.5
31.5
23.7
26.9
15.1
13.3
3.6
3.0
23.5
22.8
2.6
2.3
HT Media
Neutral
102
-
2,383
2,589
2,830
15.1
15.4
8.3
10.9
12.3
9.4
1.0
0.9
8.4
10.4
0.5
0.3
Jagran Prakashan
Buy
180
225
5,619
2,541
2,835
28.5
28.7
12.7
14.1
14.2
12.8
3.0
2.6
21.3
21.4
2.1
1.8
Sun TV Network
Neutral
996
-
39,259
3,238
3,789
51.9
55.1
30.9
38.0
32.2
26.2
9.2
8.1
30.0
31.0
11.6
9.8
Hindustan Media
Neutral
255
-
1,874
1,002
1,074
23.3
23.5
29.2
33.8
8.8
7.6
1.4
1.2
15.6
15.4
0.9
0.6
Ventures
TV Today Network
Buy
429
500
2,556
667
727
27.7
27.7
18.6
20.1
23.0
21.4
3.6
3.7
15.6
17.3
3.4
3.1
Music Broadcast Limited Accumulate
382
434
2,178
271
317
91.0
109.0
6.0
10.0
63.6
38.2
4.0
3.6
6.5
9.3
7.6
6.3
Metals & Mining
Coal India
Neutral
270
-
167,817
82,301
91,235
17.0
18.0
17.1
20.5
15.8
13.2
3.0
2.8
45.0
55.0
1.7
1.5
Hind. Zinc
Neutral
310
-
130,943
22,108
24,555
57.0
58.0
22.1
26.3
14.0
11.8
4.5
3.7
32.0
35.0
4.9
4.1
Hindalco
Neutral
272
-
61,072
102,350
105,355
13.5
14.5
21.5
24.5
12.7
11.1
1.7
1.5
15.0
15.2
1.2
1.1
JSW Steel
Neutral
264
-
63,911
64,500
68,245
21.1
21.5
20.1
21.2
13.2
12.5
2.4
2.1
-
-
1.7
1.6
NMDC
Neutral
149
-
47,015
10,209
11,450
47.0
48.0
11.1
12.1
13.4
12.3
1.9
1.8
-
-
4.1
3.7
SAIL
Neutral
92
-
37,914
54,100
63,555
3.0
10.0
(10.0)
1.5
61.2
1.2
1.2
-
-
1.7
1.4
Vedanta
Neutral
328
-
121,831
81,206
87,345
28.0
29.0
26.5
33.5
12.4
9.8
2.8
2.4
-
-
2.2
1.9
Tata Steel
Neutral
729
-
70,811
121,445
126,500
16.2
17.2
65.4
81.3
11.2
9.0
1.8
1.5
-
-
1.1
1.0
Oil & Gas
GAIL
Neutral
494
-
83,584
53,115
52,344
14.2
15.3
30.0
31.1
16.5
15.9
2.1
1.9
-
-
1.3
1.3
ONGC
Neutral
197
-
252,751
83,111
84,934
44.2
44.9
16.4
16.9
12.0
11.7
1.5
1.4
-
-
2.9
2.9
Indian Oil Corp
Neutral
386
-
187,632
396,116
432,560
8.5
8.8
40.1
42.2
9.6
9.2
1.7
1.5
-
-
0.6
0.6
Reliance Industries
Neutral
911
-
592,757
257,711
267,438
17.0
18.2
89.1
89.5
10.2
10.2
1.0
0.9
-
-
2.0
1.9
Pharmaceuticals
Alembic Pharma
Accumulate
529
600
9,981
3,346
3,915
19.6
19.2
21.0
23.9
25.2
22.2
4.5
3.8
19.1
18.4
3.0
2.6
Alkem Laboratories Ltd
Accumulate
2,200
2,341
26,306
6,320
7,341
17.5
19.8
72.7
96.6
30.3
22.8
5.4
4.5
16.7
18.7
4.1
3.5
Aurobindo Pharma
Buy
672
823
39,363
17,086
19,478
22.1
22.0
44.7
51.4
15.0
13.1
3.3
2.7
24.7
22.7
2.4
2.1
Aventis*
Neutral
4,694
-
10,810
2,411
2,698
18.8
18.8
151.6
163.9
31.0
28.6
4.8
3.9
25.4
27.5
4.1
3.4
Cadila Healthcare
Neutral
428
-
43,837
11,365
12,926
20.0
20.0
18.4
20.5
23.3
20.9
5.1
4.2
24.3
22.2
3.9
3.4
Cipla
Sell
607
462
48,848
16,163
18,711
16.6
16.9
20.7
24.3
29.3
25.0
3.5
3.1
12.6
13.1
3.2
2.7
Dr Reddy's
Reduce
2,408
2,052
39,925
13,734
15,548
17.7
20.2
69.9
102.0
34.4
23.6
3.1
2.8
9.2
12.4
3.1
2.7
GSK Pharma*
Sell
2,458
2,000
20,816
2,968
3,324
13.8
15.9
37.8
46.3
65.0
53.1
11.4
12.5
16.7
22.4
6.8
6.2
Stock Watch
January 03, 2018
Company Name
Reco
CMP
Target
Mkt Cap
Sales ( Čcr )
OPM(%)
EPS (Č)
PER(x)
P/BV(x)
RoE(%)
EV/Sales(x)
(Č)
Price ( Č)
( Č cr )
FY18E FY19E
FY18E
FY19E
FY18E
FY19E
FY18E
FY19E
FY18E
FY19E
FY18E
FY19E
FY18E
FY19E
Pharmaceuticals
Indoco Remedies
Sell
282
136
2,595
1,114
1,297
9.9
13.9
5.6
11.4
50.3
24.7
3.8
3.4
7.7
14.5
2.6
2.2
Ipca labs
Neutral
588
-
7,422
3,256
3,647
14.1
17.1
16.2
25.4
36.3
23.2
2.8
2.5
8.0
11.5
2.3
2.1
Lupin
Buy
876
1,091
39,584
16,240
18,562
21.3
21.7
42.5
49.6
20.6
17.7
2.6
2.3
13.3
13.7
2.5
2.1
Natco Pharma
Accumulate
967
1,057
17,839
1,886
2,016
32.3
29.5
23.2
22.0
41.8
43.9
8.7
7.7
20.9
17.6
9.3
8.7
Sun Pharma
Accumulate
572
630
137,117
28,312
32,153
20.7
23.1
18.5
23.3
30.9
24.5
3.5
3.2
11.5
14.6
4.5
3.8
Syngene International
Neutral
560
-
11,204
1,394
1,818
33.0
36.5
15.8
21.0
35.4
26.7
6.6
5.4
18.6
20.3
8.0
6.1
Power
Tata Power
Neutral
99
-
26,899
32,547
33,806
20.5
20.5
4.7
5.4
21.2
18.6
2.0
1.7
10.5
10.5
1.8
1.8
NTPC
Neutral
179
-
147,388
86,070
101,246
28.3
30.7
12.9
16.2
13.9
11.0
1.4
1.3
10.6
12.4
3.1
2.8
Power Grid
Accumulate
201
223
104,920
29,183
32,946
89.7
90.0
18.0
20.8
11.2
9.6
1.9
1.7
17.7
18.2
7.5
7.0
Real Estate
Prestige Estate
Neutral
322
-
12,079
4,607
5,146
21.0
22.2
7.9
9.8
40.8
32.9
2.5
2.3
10.3
12.0
3.8
3.4
MLIFE
Accumulate
466
522
2,389
487
590
12.3
17.8
21.0
31.2
22.2
14.9
1.2
1.1
5.2
7.4
3.6
3.0
Telecom
Bharti Airtel
Neutral
516
-
206,386
97,903
105,233
36.0
36.3
9.3
11.1
55.5
46.7
2.7
2.5
5.0
5.6
3.1
2.8
Idea Cellular
Neutral
101
-
36,346
35,012
37,689
27.1
27.7
(4.4)
(2.7)
1.6
1.6
(6.8)
(4.6)
2.3
2.1
Others
Abbott India
Neutral
5,433
-
11,545
3,244
3,723
14.9
16.1
167.5
209.4
32.4
26.0
7.2
6.0
23.7
24.8
3.2
2.7
Asian Granito
Accumulate
568
639
1,708
1,169
1,286
12.5
12.5
16.0
19.7
35.5
28.8
3.8
3.4
10.7
11.6
1.7
1.5
Bajaj Electricals
Neutral
490
-
4,995
4,646
5,301
6.7
7.6
16.1
22.3
30.5
22.0
5.0
4.2
16.4
19.2
1.1
0.9
Banco Products (India)
Neutral
256
-
1,828
1,530
1,695
13.2
12.7
19.0
20.0
13.5
12.8
2.2
1.9
0.2
0.2
1.1
123.6
Coffee Day Enterprises
Neutral
273
-
5,757
3,494
3,913
17.4
18.0
4.8
5.7
-
47.8
2.4
2.3
-
0.1
2.1
1.9
Ltd
Elecon Engineering
Neutral
105
-
1,176
171
201
15.0
16.2
36.0
43.0
2.9
2.4
0.2
0.2
0.1
0.1
6.3
5.3
Garware Wall Ropes
Neutral
915
-
2,002
928
1,003
15.2
15.2
39.4
43.2
23.2
21.2
3.8
3.3
16.5
15.4
2.0
1.8
Goodyear India*
Neutral
1,077
-
2,484
1,717
1,866
11.8
12.3
47.9
49.8
22.5
21.6
3.5
3.0
15.6
15.7
1.2
164.1
Hitachi
Neutral
2,656
-
7,221
2,355
2,715
10.3
10.8
49.0
60.9
54.2
43.6
12.7
10.0
0.2
0.2
3.1
2.7
HSIL
Neutral
498
-
3,597
2,240
2,670
14.6
15.0
17.0
22.0
29.3
22.6
2.4
2.3
0.1
0.1
1.8
1.5
Interglobe Aviation
Neutral
1,201
-
46,171
22,570
27,955
14.2
15.0
63.6
81.8
18.9
14.7
9.9
8.4
0.5
0.6
1.7
1.3
Jyothy Laboratories
Neutral
380
-
6,899
1,781
2,044
14.1
15.0
9.4
10.5
40.6
36.1
8.6
8.1
0.2
0.2
4.1
3.5
Linc Pen & Plastics
Neutral
385
-
569
420
462
9.3
9.3
15.3
17.1
25.2
22.5
4.2
4.4
16.9
19.5
1.4
1.3
M M Forgings
Neutral
1,195
-
1,442
542
642
20.1
21.0
41.6
56.8
28.7
21.0
4.0
3.4
0.1
0.2
3.1
2.7
Mirza International
Neutral
159
-
1,908
1,148
1,285
18.0
18.0
8.0
9.4
19.7
17.0
3.3
2.8
16.3
16.1
1.8
1.6
Navkar Corporation
Buy
189
265
2,846
561
617
41.5
41.5
11.5
12.7
16.4
14.9
1.7
1.6
10.5
10.4
5.7
5.0
Stock Watch
January 03, 2018
Company Name
Reco
CMP
Target Mkt Cap
Sales ( Čcr )
OPM(%)
EPS (Č)
PER(x)
P/BV(x)
RoE(%)
EV/Sales(x)
(Č)
Price ( Č)
( Č cr )
FY18E FY19E FY18E FY19E FY18E FY19E
FY18E FY19E
FY18E FY19E
FY18E FY19E
FY18E FY19E
Others
Nilkamal
Neutral
1,888
-
2,818
2,317
2,525
11.4
11.1
96.0
105.0
19.7
18.0
3.3
2.9
0.2
0.2
1.2
1.1
Parag Milk Foods
Neutral
297
-
2,502
1,987
2,379
7.6
9.0
12.4
18.3
24.0
16.3
3.4
3.0
8.2
13.2
1.4
1.2
Radico Khaitan
Neutral
292
-
3,894
1,811
1,992
13.2
13.2
8.1
8.8
36.1
33.2
3.6
4.0
10.1
12.0
2.5
2.3
Relaxo Footwears
Neutral
671
-
8,072
1,981
2,310
13.7
14.5
12.0
15.5
55.9
43.3
10.9
8.8
0.2
0.2
4.1
3.5
Siyaram Silk Mills
Accumulate
720
813
3,373
1,769
1,981
12.7
12.7
22.6
26.2
31.8
27.4
4.9
4.3
15.5
15.5
2.1
1.9
Styrolution ABS India* Neutral
1,044
-
1,836
1,800
1,980
8.0
8.1
42.0
46.2
24.9
22.6
2.8
2.5
0.1
0.1
1.1
1.0
Surya Roshni
Neutral
380
-
1,664
4,870
5,320
7.7
7.8
22.8
28.1
16.7
13.5
2.2
1.9
0.1
0.1
0.6
0.5
TVS Srichakra
Neutral
3,818
-
2,923
2,729
2,893
12.7
12.5
248.5
265.0
15.4
14.4
4.4
3.6
0.3
0.3
1.1
1.0
Visaka Industries
Neutral
647
-
1,027
1,104
1,214
12.1
12.6
31.0
37.9
20.9
17.1
2.5
2.3
0.1
0.1
1.2
1.0
VIP Industries
Buy
347
400
4,906
1,450
1,693
10.4
10.5
6.5
7.8
53.1
44.5
11.2
9.8
21.1
22.1
3.4
2.9
Navin Fluorine
Neutral
810
-
3,997
945
1,154
17.5
17.9
28.7
34.8
28.2
23.3
4.7
4.0
-
-
3.7
3.0
Century Plyboards India Buy
339
400
7,528
2,007
2,510
22.4
22.6
8.4
11.1
40.3
30.5
8.6
7.0
21.3
22.9
4.1
3.3
LT Foods
Accumulate
91
102
2,899
3,287
3,747
11.1
11.5
4.4
5.2
20.6
17.4
3.0
2.5
17.5
17.6
1.4
1.2
Ruchira Papers
Buy
200
244
449
470
532
15.6
15.6
16.5
19.0
12.1
10.5
2.4
2.0
20.0
19.2
1.1
1.0
Source: Company, Angel Research; Note: *December year end; #September year end; &October year end; Price as on January 02, 2018
Market Outlook
January 03, 2018
Research Team Tel: 022 - 39357800
DISCLAIMER
Angel Broking Private Limited (hereinafter referred to as “Angel”) is a registered Member of National Stock Exchange of India
Limited,Bombay Stock Exchange Limited and Metropolitan Stock Exchange Limited. It is also registered as a Depository Participant with
CDSL and Portfolio Manager with SEBI. It also has registration with AMFI as a Mutual Fund Distributor. Angel Broking Private Limited is a
registered entity with SEBI for Research Analyst in terms of SEBI (Research Analyst) Regulations, 2014 vide registration number
INH000000164. Angel or its associates has not been debarred/ suspended by SEBI or any other regulatory authority for accessing
/dealing in securities Market. Angel or its associates/analyst has not received any compensation / managed or
co-managed public offering of securities of the company covered by Analyst during the past twelve months.
This document is solely for the personal information of the recipient, and must not be singularly used as the basis of any investment
decision. Nothing in this document should be construed as investment or financial advice. Each recipient of this document should make
such investigations as they deem necessary to arrive at an independent evaluation of an investment in the securities of the companies
referred to in this document (including the merits and risks involved), and should consult their own advisors to determine the merits and
risks of such an investment.
Reports based on technical and derivative analysis center on studying charts of a stock's price movement, outstanding positions and
trading volume, as opposed to focusing on a company's fundamentals and, as such, may not match with a report on a company's
fundamentals. Investors are advised to refer the Fundamental and Technical Research Reports available on our website to evaluate the
contrary view, if any.
The information in this document has been printed on the basis of publicly available information, internal data and other reliable
sources believed to be true, but we do not represent that it is accurate or complete and it should not be relied on as such, as this
document is for general guidance only. Angel Broking Pvt. Limited or any of its affiliates/ group companies shall not be in any way
responsible for any loss or damage that may arise to any person from any inadvertent error in the information contained in this report.
Angel Broking Pvt. Limited has not independently verified all the information contained within this document. Accordingly, we cannot
testify, nor make any representation or warranty, express or implied, to the accuracy, contents or data contained within this document.
While Angel Broking Pvt. Limited endeavors to update on a reasonable basis the information discussed in this material, there may be
regulatory, compliance, or other reasons that prevent us from doing so.
This document is being supplied to you solely for your information, and its contents, information or data may not be reproduced,
redistributed or passed on, directly or indirectly.
Neither Angel Broking Pvt. Limited, nor its directors, employees or affiliates shall be liable for any loss or damage that may arise from
or in connection with the use of this information.